India runs a genuine refined-fuel surplus — US$53.0 billion of petroleum products out against US$9.3 billion in. But the biggest buyer is the Netherlands, not the neighbourhood, and Nepal and Bhutan are already supplied almost entirely by Indian public-sector refiners. On ethanol the premise reverses completely: India is a net importer.
Refining · Petroleum trade · Neighbourhood exports
India Sells the World $53 Billion of Fuel. Its Neighbours Buy 5% of It.
Published · v1.0.0 · DGCI&S TRADESTAT FY2024-25 and FY2025-26 · PPAC consumption to July 2026
The surplus is real
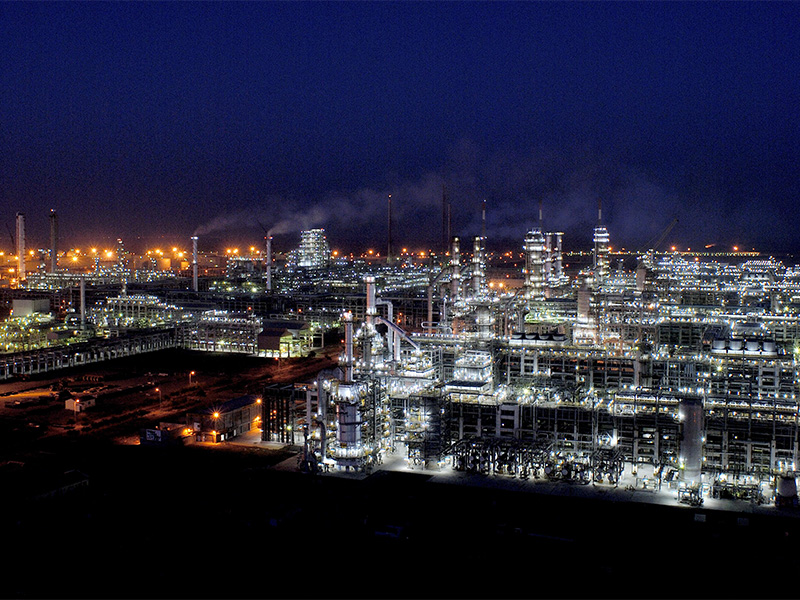
India buys crude and sells fuel, and the margin between them is one of the country’s largest export earnings.
Start with the claim itself, because it is the part that survives checking. Under HS Chapter heading 2710 — petroleum oils other than crude, which is where petrol, diesel, jet fuel and fuel oil sit — India exported US$52,973 million in FY2025-26 and imported US$9,320 million. That is a net surplus of US$43,653 million, and it is one of the largest single-chapter surpluses in Indian trade.
Split by product, the surplus is diesel-led. Light oils, the petrol group, exported US$18,336 million. The heavier stream — diesel, jet fuel and fuel oil together — exported US$34,636 million, nearly twice as much.
Exhibit 1
India’s refined-petroleum trade, by product group
HS 2710 and its two main sub-headings. Export values only, except the chapter total which is shown against imports.
| Product group | HS code | FY2024-25, US$ mn | FY2025-26, US$ mn | Change, % |
|---|---|---|---|---|
| Light oils (petrol group) | 271012 | 19,340 | 18,336 | −5.2 |
| Diesel, jet fuel, fuel oil | 271019 | 43,149 | 34,636 | −19.7 |
| All refined petroleum, exports | 2710 | 62,550 | 52,973 | −15.3 |
| All refined petroleum, imports | 2710 | 9,671 | 9,320 | −3.6 |
| Net surplus | 2710 | 52,879 | 43,653 | −17.4 |
DGCI&S TRADESTAT, commodity-wise all-countries export and import queries, HS 2710 / 271012 / 271019, run 8 August 2026. Sub-heading totals do not sum to the chapter total because 2710 also contains lubricating oils, waste oils and other streams. Values are US$ million; TRADESTAT returned no quantity data for these queries, so everything here is value, not volume — a 15% fall in value is not a 15% fall in barrels when crude prices have moved.
Where it actually goes
Rotterdam, not Kathmandu.
The single largest destination for Indian refined petroleum is the Netherlands, at US$8,435 million — 15.9% of the total, and almost all of it in the diesel-and-fuel-oil group. That is the Rotterdam trading hub, and it is the visible end of a well-documented trade: India buys discounted crude, refines it, and sells the product into a European market that stopped buying Russian refined fuel directly.
The next four buyers are the United Arab Emirates, Singapore, the United States and Tanzania. The neighbourhood does not appear until well down the list.
Exhibit 2
Top ten destinations for Indian refined petroleum, FY2025-26
HS 2710. “Unspecified” is TRADESTAT’s own category for cargoes without a declared destination, most likely ship-to-ship or bunker sales.
| Destination | Value, US$ mn | Share of exports, % |
|---|---|---|
| Netherlands | 8,435 | 15.9 |
| United Arab Emirates | 5,612 | 10.6 |
| Singapore | 4,444 | 8.4 |
| United States | 3,502 | 6.6 |
| Tanzania | 3,025 | 5.7 |
| Australia | 2,673 | 5.0 |
| China | 2,458 | 4.6 |
| Unspecified | 2,418 | 4.6 |
| South Africa | 1,882 | 3.6 |
| Togo | 1,768 | 3.3 |
DGCI&S TRADESTAT, HS 2710 commodity-wise all-countries export, FY2025-26, run 8 August 2026. Shares calculated against the summed all-partner total of US$52,973 million.
The neighbourhood, measured
Not an opportunity to open. A market already held.
Nepal, Sri Lanka and Bhutan together bought US$2,775 million of Indian refined petroleum in FY2025-26 — 5.2% of exports. Add Bangladesh and it reaches 6.8%. These are real numbers and not trivial ones, but they describe a modest share of a very large trade, and they are not a frontier.
Nepal and Bhutan are not open markets waiting to be entered; they are already supplied. PPAC states the position plainly in the notes to its own import-export tables: “Nepal sales by IOCL, Nepal and Bhutan sales by BPCL are considered in total exports”. Indian public-sector refiners are not competing for these markets — they are the incumbent, effectively the sole supplier, and the trade is booked as an export of the parent company’s own subsidiary sales. There is no share left to win. Nepal’s purchases in fact fell 5.3% last year.
Exhibit 3
Indian refined-petroleum exports to South Asian neighbours
HS 2710. Shares are of India’s total refined-petroleum exports in the year shown.
| Destination | FY2024-25, US$ mn | FY2025-26, US$ mn | Change, % | Share of exports, % |
|---|---|---|---|---|
| Nepal | 1,607 | 1,522 | −5.3 | 2.87 |
| Sri Lanka | 777 | 1,013 | +30.3 | 1.91 |
| Bangladesh | 942 | 804 | −14.6 | 1.52 |
| Bhutan | 201 | 240 | +19.4 | 0.45 |
| Myanmar | 6 | 14 | +114.6* | 0.03 |
| Maldives | 10 | 8 | −18.7 | 0.02 |
| Nepal + Sri Lanka + Bhutan | 2,585 | 2,775 | +7.3 | 5.24 |
DGCI&S TRADESTAT, HS 2710, FY2024-25 and FY2025-26, run 8 August 2026. TRADESTAT lists Sri Lanka as “SRI LANKA DSR” and Bangladesh as “BANGLADESH PR”. Combined-row change is computed on the two years shown, not averaged from the component percentages. *Myanmar’s change is calculated from unrounded TRADESTAT values; the rounded figures shown (US$6mn to US$14mn) imply +133.3%.
Ethanol: two surpluses, and only one of them is real
India has idle distilleries and an alcohol trade deficit at the same time. Both are true.
The natural extension of a fuel-surplus argument is to add ethanol, and here the picture divides in a way that matters. There is a genuine and large surplus of capacity. There is no surplus of traded product. Confusing the two is what turns a real industrial problem into an export plan that the customs data cannot support.
Start with what India actually ships. In FY2025-26 India exported US$54.3 million of ethyl alcohol under HS 2207 and imported US$407.2 million — a net deficit of US$352.9 million. Imports came overwhelmingly from the United States (US$381.4 million, 94%). Exports went mainly to Congo, Kenya and Tanzania. Exports to Nepal were US$0.09 million; Bhutan bought none and sold India marginally more than it bought. On the measure that records goods crossing a border, India is a buyer of alcohol, not a seller.
Exhibit 4
India’s ethyl alcohol trade — a net import position
HS 2207, all grades. This heading covers fuel, industrial and potable alcohol; the trade data does not separate them.
| Direction | FY2024-25, US$ mn | FY2025-26, US$ mn | Largest counterpart FY2025-26 |
|---|---|---|---|
| Exports | 60.2 | 54.3 | Congo D.R. 10.5 |
| Imports | 471.2 | 407.2 | United States 381.4 |
| Net position | −411.0 | −352.9 | — |
| Exports to Nepal | 0.13 | 0.09 | — |
| Exports to Bhutan | 0.00 | 0.00 | — |
DGCI&S TRADESTAT, HS 2207 commodity-wise all-countries export and import, run 8 August 2026. HS 2207 aggregates undenatured and denatured ethyl alcohol and does not distinguish fuel ethanol from industrial or potable grades, so this is the country’s overall alcohol position rather than the blending programme specifically. The direction of the imbalance is unambiguous either way.
Now the capacity side, which points the other way. CareEdge Ratings reported in May 2026 that installed ethanol capacity has passed 2,000 crore litres — 20 billion litres — with a further 400 crore litres (4 billion) expected. Against that, the E20 blending programme absorbs roughly 1,100 crore litres (11 billion) and non-fuel uses in chemicals, pharmaceuticals and liquor take 300–350 crore litres (3–3.5 billion). Distilleries are running at about 60%, and CareEdge expects utilisation to stay capped at 65–75% for the next three years while flex-fuel vehicle adoption remains gradual.
The two findings are not in conflict, and read together they say something specific: India has built distillery capacity well ahead of the demand that would run it, and the resulting idle capacity is not a stock of exportable litres. It is unused plant. Turning it into exports requires feedstock, a delivered price that competes, and buyers — none of which arrive because the capacity exists. Meanwhile PPAC’s consumption reporting notes that “MS Consumption includes Ethanol Blending”: the ethanol India does produce is counted inside its petrol consumption, because that is where policy sends it. A blending programme is a mechanism for absorbing domestic ethanol, not for generating a surplus to sell.
What the data supports
A different, smaller, more defensible claim.
India is, on the evidence, already the refinery for its immediate neighbourhood, and has been for long enough that the arrangement is recorded in a footnote rather than announced as a strategy. That is a real position and worth defending. It is not, however, an untapped opportunity, and the numbers do not support treating it as one:
- Nepal and Bhutan are saturated. Supply runs through IOCL and BPCL subsidiaries. Nepal’s purchases fell last year. Growth here depends on Nepali and Bhutanese fuel demand, which India does not control.
- Sri Lanka is the live opportunity — up 30.3%, and a competitive market rather than a captive one.
- Bangladesh went the other way, down 14.6%, which is the reminder that a neighbour is not automatically a customer.
- The surplus is shrinking in value and its centre of gravity is Rotterdam, a market exposed to European sanctions policy in a way the neighbourhood is not.
- Ethanol is a net import. Any plan built on exporting it starts US$353 million in the wrong direction.
The strongest version of the argument is not that India should start selling fuel to its neighbours. It is that India already does, that the position is quietly near-total in two of the three markets, and that the only one with room to grow is the one where India has to compete on price. That is a less rousing claim than the one usually made, and it has the advantage of matching the trade data.
Sources. Trade figures — DGCI&S TRADESTAT (Directorate General of Commercial Intelligence and Statistics, Ministry of Commerce & Industry), commodity-wise all-countries export and import queries for HS 2710, 271012, 271019 and 2207, FY2024-25 and FY2025-26, run 8 August 2026. All values are US$ million as returned by TRADESTAT; the quantity columns were empty for these queries, so no volume figures are used anywhere in this article. Partner totals are summed across all listed partners. Consumption and supply-side notes — PPAC (Petroleum Planning & Analysis Cell, MoPNG): Flash Report on Oil & Gas, July 2026 for petrol and diesel consumption, and the notes to PPAC’s import-export tables for the treatment of Nepal and Bhutan sales. Ethanol capacity and utilisation — CareEdge Ratings, May 2026, as reported in trade press; these are a commercial ratings agency’s estimates, are attributed as such in the text, and are not used for any headline figure. Every other number on this page comes from official statistics.
About this article: Researched, written and edited by Umashankar Triplicane Dwarakanathan, with AI research assistance; every figure is meant to trace to the primary source cited. See the Editorial Policy for how sourcing, AI use and corrections work.

