Indian refiners' gross refining margin — the money made turning crude into fuel — has roughly halved in the space of a year, from $10–12 a barrel in FY2023-24 to $4–6 in FY2024-25, and stayed subdued into FY2025-26. Over the same period, LPG demand grew faster than petrol demand, LPG's own subsidy economics improved sharply, and polymer spreads widened. None of that is a coincidence refiners can ignore: the same crude barrel that makes petrol can, with the modifications this blog has already covered piece by piece, make more LPG and more petrochemical feedstock instead. This piece pulls those separate findings together into the actual margin argument for doing so.
Energy · Refining · Petrochemicals
The Margin Case: Why LPG and Petrochemicals Beat Petrol, From the Same Barrel
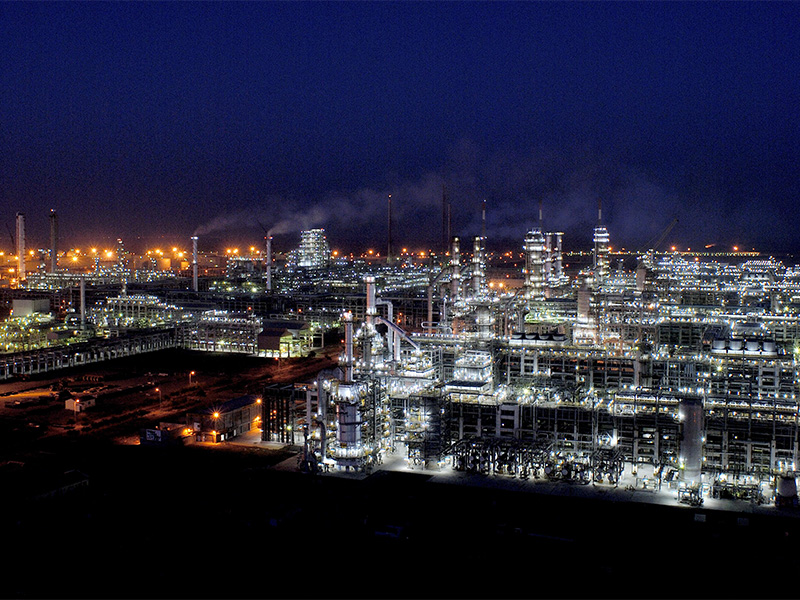
1. The fuel margin has genuinely compressed
The headline number is stark on its own. Indian OMCs' gross refining margin (GRM) — the per-barrel profit from converting crude into refined products, before marketing margin — fell from roughly $10–12/bbl in FY2023-24 to $4–6/bbl in FY2024-25, per CareEdge's own tracking of the sector, and stayed subdued through the first quarter of FY2025-26. Two structural pressures sit behind that fall: middle-distillate (diesel/jet) cracks weakening globally, and the discount India's refiners had been getting on Russian crude — which made up 35–40% of the country's crude import mix — narrowing as US sanctions on major Russian crude entities (November 2025) and an EU ban on products refined from Russian crude (January 2026) both took effect.
That is the demand side of the argument stated plainly: LPG grew faster than either transport fuel in the most recent 11-month period reported, even before accounting for the household-side supply constraints described in this blog's own coverage of PPAC's May 2026 data. A refiner watching its core fuel margin roughly halve, at the same time as LPG demand outpaces petrol demand, has a straightforward incentive to ask whether more of the barrel should come out as LPG rather than petrol — independent of any petrochemical ambition at all.
2. The import trend that makes this an opportunity, not just a margin footnote
PPAC's own Ready Reckoner data (Table 7.1, "LPG marketing at a glance") shows exactly how that demand growth has been met over the years leading into the current period, and the pattern is stark: domestic LPG production barely moved while imports did almost all of the work of meeting rising consumption.
| Year | Production, TMT | Consumption, TMT | Imports, TMT | Import dependency, % |
|---|---|---|---|---|
| 2017-18 | 12,364 | 23,342 | 11,379 | 48.7 |
| 2018-19 | 12,786 | 24,907 | 13,235 | 53.1 |
| 2019-20 | 12,823 | 26,330 | 14,809 | 56.2 |
| 2020-21 | 12,072 | 27,591 | 16,527 | 59.9 |
| 2021-22 | 12,238 | 28,335 | 17,207 | 60.7 |
Source: PPAC Ready Reckoner, Table 7.1 "LPG marketing at a glance." TMT = thousand metric tonnes. Over this five-year window, domestic LPG production fell 1.0%, consumption rose 21.4%, and imports rose 51.2% — imports absorbed the entire consumption increase and then some, as import dependency (imports as a share of consumption) climbed from 48.7% to 60.7%. More recent reporting (outside PPAC's own Ready Reckoner series checked directly for this piece) puts LPG import dependency at roughly 60–64% through FY2024-25, consistent with the trend this table already shows through FY2021-22 — this piece is not asserting the more recent figure to PPAC-Ready-Reckoner precision, only noting it sits on the same upward trajectory.
That gap is precisely the opportunity this piece's margin argument turns on. Every tonne of that rising import share is currently being sourced abroad — including, most recently, a first-of-its-kind one-year deal signed in November 2025 for Indian PSU oil companies to import 2.2 million tonnes of LPG a year from the US Gulf Coast, a structural diversification move away from Middle East-origin supply after the West Asia disruptions described elsewhere in this piece. A refiner that redirects FCC yield toward LPG, using the technical lever and the improved product-differential economics described in Sections 1 and 3, is not competing for a shrinking market: it is displacing exactly the volume growth that has, for the better part of a decade, gone to imports rather than domestic production.
3. LPG-side economics have also improved, separately from demand growth
The margin case for LPG isn't just "demand is growing" — the underlying economics of supplying it improved sharply on the input-cost side too. Saudi benchmark contract prices for propane and butane (the two components LPG is blended from) fell to their lowest since August 2023, narrowing India's LPG under-recovery — the gap between what OMCs pay to supply LPG and what they recover from consumers — from ₹98.6 per cylinder to ₹33 per cylinder. That narrower gap was worth an estimated ₹3,400 crore EBITDA boost in a single quarter for the sector, on top of a separate ₹5,000 crore in monthly government compensation that began in November 2025. Put simply: the two of the three levers a refiner controls when deciding how much of a barrel to route toward LPG — input cost and government support — both moved in LPG's favour over the same period its core fuel margin was compressing.
This is also exactly the mechanism the FCC-yield technical paper cited in this blog's earlier coverage of the FCC lever states directly, in its own words, as its conclusion: "Increasing FCC reactor LPG yields at the expense of gasoline increases profitability due to product differential values." That sentence is the industry's own technical justification for the shift this piece is describing — not something this blog is inferring from adjacent data points.
4. The petrochemical side of the same barrel is widening too
The naphtha-cracker and ethylene/ethane-cracker investments already catalogued in this blog's earlier coverage — roughly ₹3.35 lakh crore across seven named projects — aren't happening in a margin vacuum either. The LDPE-naphtha spread, a standard industry proxy for polymer margin over feedstock cost, rose from about $354/tonne to $566/tonne comparing the same six-month window (October–March) a year apart — a roughly 60% widening. Propylene prices held broadly range-bound through the third quarter of 2025 (around $743–760/MT), a steadier picture than the volatility that has characterised fuel-side GRM over the same period. None of that is a promise the spread stays this wide indefinitely — petrochemical margins have their own cycle, historically a more volatile one over a full decade than refining margin, and this piece is not claiming otherwise. But over the specific recent window both figures are drawn from, the polymer side of the barrel has been the steadier, wider-margin one.
5. The GRM gap shows up in an actual refiner's own reported numbers
Reliance Industries' Jamnagar complex is the clearest real-world test of this piece's argument, because it isn't a hypothetical comparison — it's a single company's own quarterly disclosure. Jamnagar is purpose-built as an integrated refinery-plus-petrochemicals complex, feeding refinery streams directly into one of the world's largest aromatics and polymer operations (paraxylene, polypropylene, polyester intermediates) rather than selling those streams as commodity fuel. Reliance's own reported GRM for Q4 FY2024-25 was $7.6/bbl, down from $9.6/bbl a year earlier — a real decline, consistent with the sector-wide fuel-margin compression in Section 1, but still running meaningfully above the $4–6/bbl PSU OMC average for the same broad period. That gap is exactly what integration is supposed to buy: converting lower-value refinery residue into higher-value petrochemical product instead of selling it as commodity diesel or fuel oil, which is the same mechanism described mechanically, at the unit level, in the FCC-yield piece already covered on this site.
RIL's GRM figure is not perfectly comparable to the PSU OMC figure — different crude slates, different reporting conventions, and Reliance's own trading and product-placement advantages all contribute alongside the petrochemical integration this piece is highlighting. This piece is reporting the gap as directionally consistent with the integration argument, not claiming the entire $2–3/bbl difference is attributable to petrochemical integration alone.
6. Private refiners and the technology layer behind the new capacity
The petrochemical push isn't confined to the public-sector refiners already catalogued on this site. Nayara Energy — the private refiner that owns the Vadinar refinery in Gujarat — announced a ₹6,000 crore petrochemical unit alongside a separate ₹4,000 crore refinery modernisation programme, and has already tied up a ₹4,016 crore project term loan for the first phase: a 450 KTA polypropylene plant at Vadinar, including a propylene recovery unit and an upgrade to the refinery's own FCC unit — the same unit-level lever described mechanically in this site's earlier FCC piece, now visible as a named, financed private-sector capital project rather than only a public-sector one.
Behind nearly all of this new capacity — public and private — sits a single dominant technology licensor: W. R. Grace, whose UNIPOL PP process technology and CONSISTA catalysts are licensed across every major Indian polypropylene project this blog has named so far.
| Project | Location | Capacity, KTA | Note |
|---|---|---|---|
| GAIL | Usar, Maharashtra | 500 | India's first PDH+PP plant |
| GAIL | Pata, Uttar Pradesh | 60 | Commissioned, 2026 |
| BPCL | Kochi, Kerala | 400 | Reactor unit expansion |
| BPCL | Bina, Madhya Pradesh | 550 | Same cracker project referenced in the FCC-lever piece |
| Nayara Energy | Vadinar, Gujarat | 450 | Started up October 2024; targeting ~8% India PP market share |
Source: Grace (grace.com) press releases and Indian Chemical News / Digital Refining / Hydrocarbon Processing coverage of individual licensing announcements. Grace's own disclosed total licensed capacity in India exceeds 5,000 KTA (5 MTPA) across these and other projects — a figure the company itself frames as making it the leading global licensor of polypropylene process technology, not an estimate this piece has derived independently.
The pattern worth naming: three different refiner groups — one gas utility turned petrochemical player (GAIL), one public-sector refiner (BPCL), and one private refiner (Nayara) — are all building new PP capacity on licensed technology from the same single supplier. That concentration is itself a data point about how standardised and de-risked this specific expansion has become at the engineering level: none of these five projects required a bespoke, first-of-a-kind process, which is part of why so many of them have moved from announcement to construction or commissioning within a few years rather than remaining slide-deck targets.
7. What the live numbers actually show, worked out — and a distinction worth being precise about
Public crack-spread calculators (the standard industry tool for benchmarking refining margin) and refinery-optimisation tools are built almost exclusively around the fuel route — gasoline and distillate cracks against crude. Neither of the two public tools checked for this piece models a petrochemical (naphtha-to-polymer) spread directly, so this section builds that comparison from live commodity prices instead, using the same crack-spread mechanics on the fuel side and a parallel naphtha-to-polymer spread on the petrochemical side. Every figure below is a live snapshot pulled directly for this piece, not a historical average:
| Benchmark ($/bbl) | Formula | Value, $/bbl |
|---|---|---|
| 3-2-1 crack spread (fuel route) | ((2×Gasoline+1×Heating Oil)×42)/3 − Brent | 59.20/bbl |
| Simple gasoline crack | (Gasoline×42) − Brent | 43.52/bbl |
| Naphtha crack (naphtha vs. crude alone) | Naphtha ($/bbl, at 8.9 bbl/tonne) − Brent | −6.16/bbl |
| Benchmark ($/tonne) | Formula | Value, $/tonne |
|---|---|---|
| Polypropylene-over-naphtha spread | Polypropylene − Naphtha | 509.12/tonne |
| Polyethylene-over-naphtha spread | Polyethylene − Naphtha | 425.35/tonne |
Live prices used (via OilPriceAPI, 13 August 2026): Brent $88.36/bbl, Gasoline $3.14/gal, Heating Oil $4.26/gal, Naphtha $731.58/tonne, Polypropylene $1,240.70/tonne, Polyethylene $1,156.93/tonne. Naphtha $/tonne converted to $/bbl at 8.9 bbl/tonne, a standard approximation for naphtha's density (~0.73–0.75 kg/L); this piece has not verified that exact conversion factor against a refiner's own specification and it should be treated as an approximation, not an exact figure. The 3-2-1 and simple-gasoline cracks use Heating Oil as the diesel proxy, standard practice for these public benchmarks.
Read correctly, within that constraint, the live numbers are still informative on the specific point this piece has been making: naphtha alone, sold as a raw fuel-blending or feedstock commodity, currently trades at a slight discount to crude ($−6.16/bbl) — confirming that naphtha itself is not where a refiner captures value. The value capture happens one processing step later, converting that naphtha into a polymer: polypropylene currently commands a $509/tonne premium over naphtha, and polyethylene a $425/tonne premium, live on today's prices. That is the same mechanism, in real-time numbers, as the LDPE-naphtha spread widening cited in Section 4 from a different (six-month-average) data source — two independently-sourced figures pointing at the same underlying spread, on different time horizons, which is a reasonable cross-check rather than a coincidence.
8. Everything this blog has already covered is what that shift looks like in practice
None of this is hypothetical for Indian refiners — it is the mechanism behind several things already documented separately on this site. The FCC-yield lever covered earlier is the specific unit-level technology for routing more of a barrel toward LPG at petrol's expense, with a published debottlenecking cost table for doing it without a full compressor replacement. The ₹3.35 lakh crore petrochemical investment table covers seven named refiner-led projects building the ethylene, ethane and naphtha-cracking capacity this section's spread data shows is currently the wider margin. And the composite-cylinder piece covered how IOCL and HPCL are extending that same pivot one step further downstream — not just producing more LPG and more HDPE, but selling the finished, branded cylinder itself under Xtralite and HP Navya, with HPCL's own July 2026 Swiggy Instamart tie-up as the newest distribution layer on top of that.
Read end to end, the four pieces describe one coherent story: a refiner facing genuinely compressed fuel margin has, right now, a technically documented lever (the FCC modification), a financially quantifiable reason to pull it (this piece's margin data), a capital program already under way to capture the petrochemical side of it (the cracker investment table), and a consumer-facing product and distribution channel to sell the LPG-side output through (the cylinder and quick-commerce pieces). None of those four pieces individually proves the others; together, they are what "pivoting from fuel margin to LPG-and-petrochemical margin" actually looks like as it happens, not as a strategy slide.
Related on this blog
See also: The FCC Lever: Trading Petrol Yield for LPG, The Barrel Really Is Shifting: India's Refiners Quantify the Petrochemical Pivot, From Barrel to Bottle: The Petrochemical Pivot Also Makes a Lighter LPG Cylinder
Sources
- CareEdge Ratings, "OMCs' Gross Refining Margins to Moderate" — GRM trend FY2023-24 to FY2025-26, Russian crude discount narrowing, sanctions/ban context
- Business Standard, reporting on LPG under-recovery narrowing (₹98.6 to ₹33/cylinder), quarterly EBITDA benefit, and November 2025 government compensation
- Industry trade press (Business Standard/PolymerUpdate), 11M FY2025-26 petrol/diesel/LPG demand growth figures
- Industry pricing data, LDPE-naphtha spread and propylene price trend, Oct 2024–Mar 2025 vs prior year and Q3 2025
- Campbell, D., Barletta, T., Golden, S. (Process Consulting Services), "Mitigating FCC gas plant impacts when increasing reactor LPG yields," PTQ Q2 2023, Digital Refining — source of the "profitability due to product differential values" conclusion quoted in Section 3
- PPAC Ready Reckoner, Table 7.1 "LPG marketing at a glance" — production, consumption, import and import-dependency series, FY2017-18 to FY2021-22, referenced in Section 2
- All India Radio / News on Air, reporting on the November 2025 one-year, 2.2 million tonne US Gulf Coast LPG import deal
- Reliance Industries' own disclosed quarterly GRM, as reported via industry/financial press, referenced in Section 5
- W. R. Grace, press release on the Nayara Energy Vadinar UNIPOL PP plant startup (29 October 2024), and Indian Chemical News / Digital Refining / Hydrocarbon Processing coverage of Grace's UNIPOL PP licensing to GAIL (Usar, Pata) and BPCL (Kochi, Bina) — Section 6
- Polymer Update / Indian Chemical News, Nayara Energy petrochemical and refinery-modernisation capex reporting
- OilPriceAPI, live commodity prices (Brent, Gasoline, Heating Oil, Naphtha, Polypropylene, Polyethylene), pulled 13 August 2026 for the calculation in Section 7
- OilPriceAPI crack-spread calculator and RefineryCalc, checked for methodology reference in Section 7 (both are fuel-route-only tools; neither models a petrochemical spread directly)
- An earlier piece on this site, on the FCC-yield lever, the petrochemical investment table, and the composite-cylinder/quick-commerce distribution pieces cross-linked above
Margin figures in this piece are drawn from secondary industry and ratings-agency reporting (CareEdge, trade press), not primary refiner disclosures, and cover specific, sometimes non-identical reporting windows (fiscal year, calendar quarter, or a named six-month comparison) rather than a single reconciled period — readers should treat the direction of each figure as more reliable than a precise cross-comparison between them. This piece does not forecast future margins in either fuel or petrochemicals; both are historically cyclical, and the data presented describes a recent, specific window, not a permanent state.
About this article: Researched, written and edited by Umashankar Triplicane Dwarakanathan, with AI research assistance; every figure is meant to trace to the primary source cited. See the Editorial Policy for how sourcing, AI use and corrections work.

